


What Happened in the Oahu Real Estate Market in September 2025?
The Oahu real estate market began to show signs of increased activity and competition in September 2025, after following typical seasonal trends for the past couple years. Competitive indicators are strengthening: For-sale inventory has been decreasing, while sales picked up.
“Oahu housing inventory declined for both single-family homes and condos in September,” said Chief Sales Officer for Locations Chad Takesue. “Typically, inventory rises in the fall, so this change signals a possible increase in demand pressures is coming.” He added that while the re-sale condo market has favored buyers for most of 2025 and continues to lean in their favor, if current trends persist into next year, the balance may begin to shift toward a market that is more favorable to sellers.
Economic uncertainty continues to be a challenge. However, one positive is that as investors move toward the bond market, yields fall and mortgage rates tend to improve. Mortgage rates are currently below 6.5%, after dropping steadily since June and are likely to stay in the mid-6% range or lower heading into the new year—giving homebuyers and sellers a shot of confidence.
At the local-market level, single-family homes in West Oahu markets are in high demand, and for-sale inventory is comparatively lower. Home supply is tightest in Mililani, where just 1.1 months of inventory remain, indicating strong demand. Supply is also constrained in Pearl City-Aiea and Waipahu, with about two months of remaining inventory (MRI) each. Home markets where demand is weakest are Leeward, with 5.9 MRI, Nuuanu-Makiki, with 6.7 MRI, and North Shore, with 7.1 MRI.
On the condo side, the tightest supply-demand markets are Kailua, with 3.0 months of remaining inventory, and Kaneohe, Makakilo and Mililani, with 4 MRI each. West Oahu condo markets are also in high demand, with lower remaining inventory than in-town markets, with the exception of Ewa, which is softer at 5.9 MRI. Demand for condos is weakest in the Leeward market, with 9.5 MRI and Ala Moana-Kakaako, with 8.9 MRI (due to continued new product development). Elsewhere in town, where concrete condo towers and aging housing stock have been more impacted by insurance and maintenance issues, remaining inventory is still high at 6 to 8 months.
Key Takeaways from the September 2025 Locations Oahu Real Estate Report
New to real estate market data terms? See our glossary.
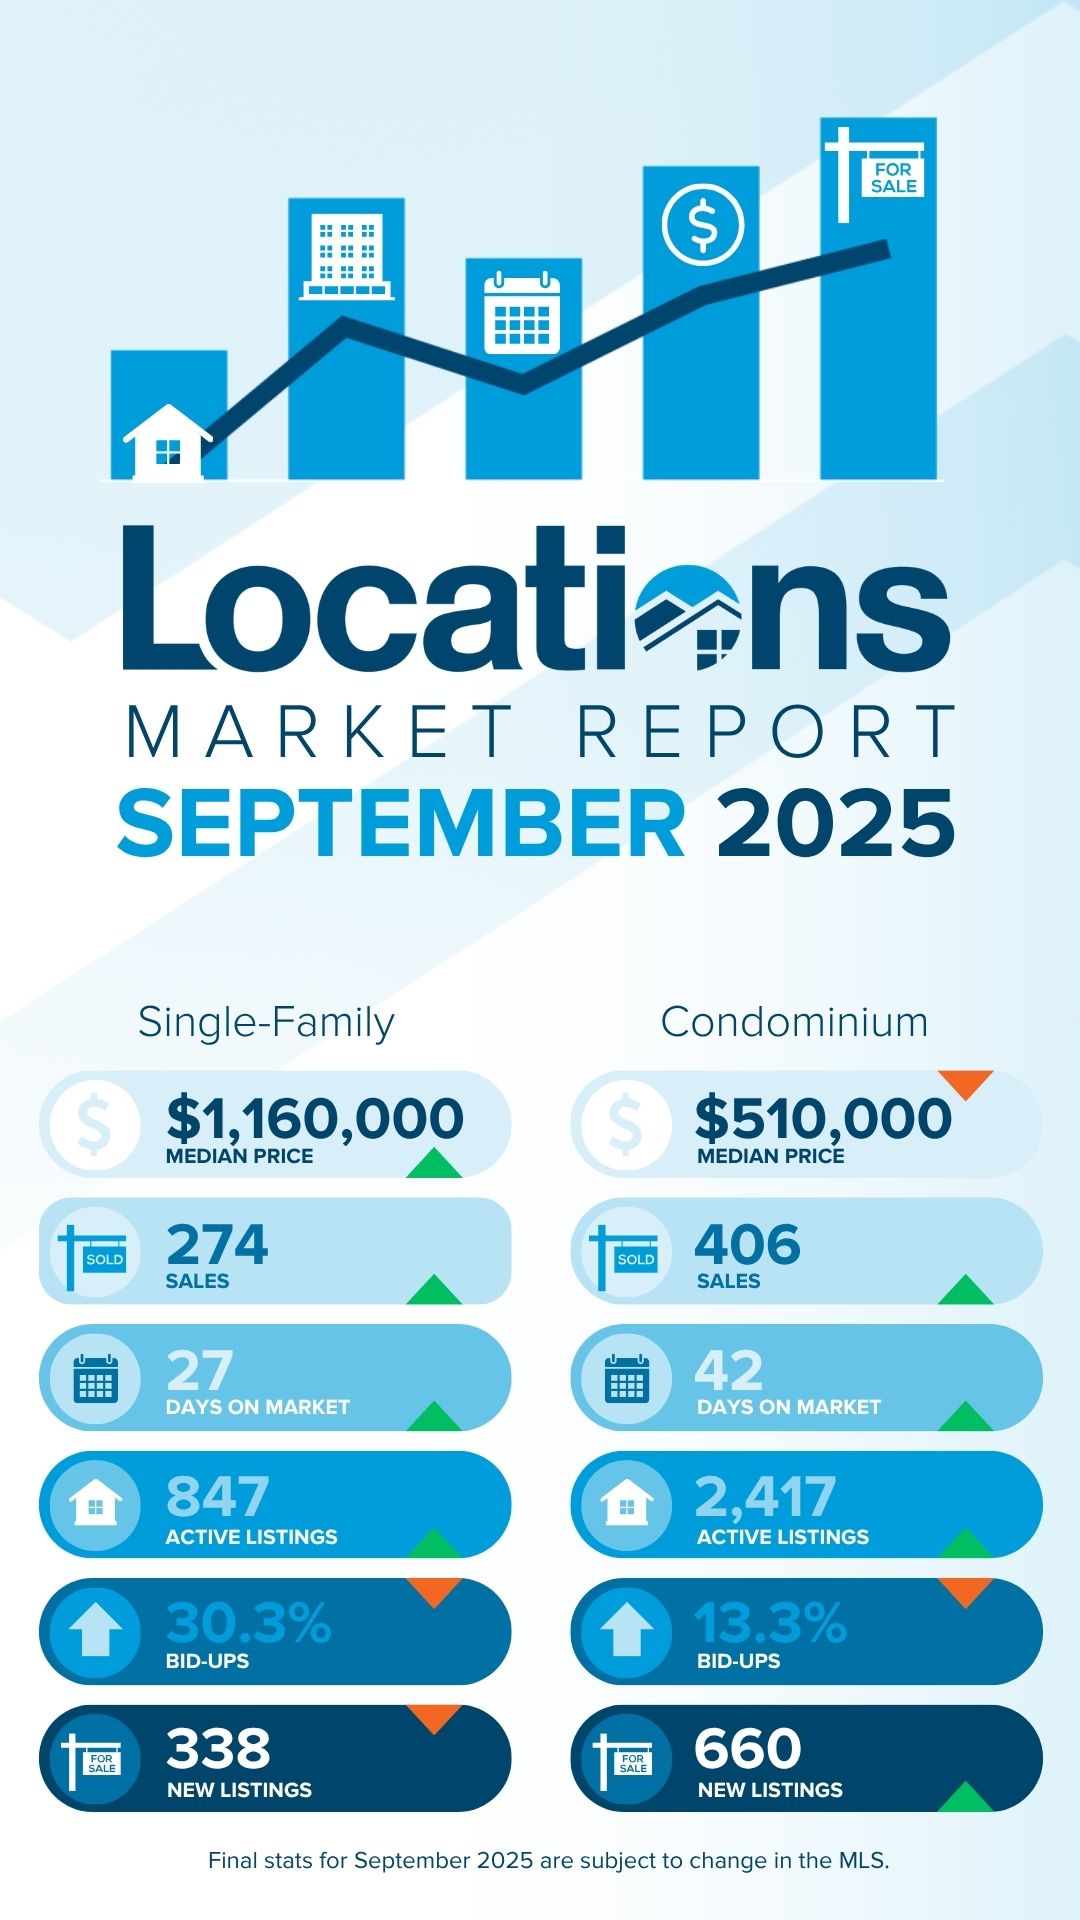
- In September 2025, the Oahu single-family home median home price of $1,160,000 was up four percent from both August 2025 and last year at this time. The median condo price of $510,000 was down one percent from last month and last year. In 2025, monthly median prices are mostly above last year for homes and flat for condos.
- Both single-family home and condo sales were above last year’s levels—an unusual bump against the seasonal trend. Home sales were 26 percent higher, while condo sales were up by 11 percent.
- There were 847 single-family homes and 2,417 condos listed for sale at the end of September 2025. Home and condo inventory is now gradually, but steadily, declining—unusual for the fall season.
- At the end of September 2025, Months of Remaining Inventory (MRI) was 3.6 months for homes and 6.6 months for condos. Although condo supply is on the decline, months of remaining inventory continue to signal a buyer-leaning market, leaving room for opportunities in select segments.
- The median Days on Market (DOM) in September 2025 was 27 days for homes and 42 days for condos. Condos have been taking longer to sell in 2025; however, market time has been decreasing over the past few months.
- Competitive pressures continue in 2025—steadier for homes and softer for condos. In September 2025, 30.3 percent of homes sold and 13.3 percent of condos sold were bid up over the asking price—one in every three homes and one in every 7.5 condos.
What Happened in Oahu Single-Family Home Markets in September 2025?
Market statistics can vary greatly by neighborhood, so it's important to consult a knowledgeable Realtor who has access to market-level data.
Here's a detailed breakdown of key Oahu single-family home market areas, looking at the past 12 months:
West Honolulu Homes
West Honolulu home sales rose 30% to 160 homes. The median price was flat at $1,032,500. The median DOM increased 13% to 18 days. The bid-up percentage climbed 19% to 38.8%. MRI declined 29% to 2.8 months, while active listings fell 8% to 37 homes.
Nuuanu-Makiki Homes
Nuuanu-Makiki home sales dipped 3% to 114 homes. The median price increased 11% to $1,335,000. The median DOM nearly doubled, up 88% to 30 days. The bid-up percentage rose 4% to 25.4%. MRI increased 41% to 6.7 months, and active listings climbed 36% to 64 homes.
Manoa Homes
Manoa home sales fell 13% to 62 homes. The median price decreased 2% to $1,610,000. The median DOM dropped 46% to 14 days. The bid-up percentage rose 36% to 30.6%. MRI declined 29% to 2.5 months, while active listings fell 38% to 13 homes.
Kaimuki Homes
Kaimuki home sales rose 13% to 147 homes. The median price held steady at $1,240,000. The median DOM was nearly unchanged, down 3% to 14 days. The bid-up percentage edged up 4% to 32.7%. MRI dipped 3% to 2.9 months, while active listings rose 9% to 35 homes.
Waialae-Kahala Homes
Waialae-Kahala home sales increased 31% to 94 homes. The median price rose 4% to $2,469,000. The median DOM decreased 5% to 21 days. The bid-up percentage fell 11% to 29.8%. MRI declined 20% to 2.9 months, while active listings rose 5% to 23 homes.
East Oahu Homes
East Oahu home sales were flat at 139 homes. The median price was unchanged at $1,650,000. The median DOM decreased 11% to 17 days. The bid-up percentage fell 5% to 25.2%. MRI climbed 37% to 3.5 months, while active listings rose 37% to 41 homes.
Hawaii Kai Homes
Hawaii Kai home sales rose 8% to 147 homes. The median price increased 1% to $1,650,000. The median DOM decreased 18% to 16 days. The bid-up percentage inched up 3% to 26.5%. MRI climbed 10% to 3.6 months, while active listings rose 19% to 44 homes.
Kailua Homes
Kailua home sales rose 2% to 241 homes. The median price was steady at $1,680,000. The median DOM increased 14% to 16 days. The bid-up percentage dropped 11% to 28.6%. MRI rose 20% to 3.5 months, while active listings increased 22% to 71 homes.
Kaneohe Homes
Kaneohe home sales edged up 1% to 205 homes. The median price increased 8% to $1,295,000. The median DOM rose 21% to 17 days. The bid-up percentage jumped 28% to 36.1%. MRI was steady, up 3% to 2.7 months, while active listings rose 5% to 46 homes.
North Shore Homes
North Shore home sales rose 25% to 76 homes. The median price fell 6% to $1,462,500. The median DOM climbed 26% to 39 days. The bid-up percentage dropped 35% to 17.1%. MRI decreased 25% to 7.1 months, while active listings dipped 6% to 45 homes.
Leeward Homes
Leeward home sales declined 8% to 218 homes. The median price rose 1% to $676,000. The median DOM increased 27% to 45 days. The bid-up percentage rose 22% to 26.1%. MRI increased 9% to 5.9 months, while active listings were unchanged at 108 homes.
Ewa Homes
Ewa home sales dipped 1% to 467 homes. The median price increased 4% to $925,000. The median DOM rose 35% to 31 days. The bid-up percentage slipped 4% to 30.0%. MRI rose 11% to 3.5 months, while active listings grew 10% to 135 homes.
Makakilo Homes
Makakilo home sales increased 27% to 103 homes. The median price rose 9% to $1,100,000. The median DOM fell 3% to 29 days. The bid-up percentage surged 75% to 28.2%. MRI decreased 5% to 4.8 months, while active listings rose 21% to 41 homes.
Waipahu Homes
Waipahu home sales rose 16% to 185 homes. The median price held steady at $950,000. The median DOM rose 12% to 19 days. The bid-up percentage fell 12% to 35.1%. MRI decreased 27% to 2.1 months, while active listings dropped 15% to 33 homes.
Mililani Homes
Mililani home sales increased 13% to 148 homes. The median price rose 1% to $1,085,000. The median DOM increased 22% to 20 days. The bid-up percentage was nearly flat, down 1% to 31.8%. MRI declined 31% to 1.1 months, while active listings fell 22% to 14 homes.
Pearl City-Aiea Homes
Pearl City-Aiea home sales were nearly unchanged, down 1% to 213 homes. The median price held steady at $1,050,000. The median DOM fell 7% to 14 days. The bid-up percentage declined 18% to 31.9%. MRI remained flat at 2.0 months, while active listings were unchanged at 36 homes.
What Happened in Oahu Condo Markets in September 2025?
Here's a detailed breakdown of key Oahu condo market areas, looking at the past 12 months:
Salt Lake Condos
Salt Lake condo sales slipped 1% to 148 units, while the median price fell 7% to $399,900. The median Days on Market (DOM) nearly doubled, up 96% to 49 days, and the bid-up percentage dropped 50% to 12.2%. Months of Remaining Inventory (MRI) rose 34% to 7.1 months, and active listings increased 33% to 88 condos.
Downtown-Nuuanu Condos
Downtown-Nuuanu condo sales declined 4% to 234 units, with the median price down 4% to $385,000. The median DOM rose 47% to 46 days, while the bid-up percentage fell 41% to 9.0%. MRI climbed 40% to 6.6 months, and active listings increased 34% to 129 condos.
Ala Moana-Kakaako Condos
Ala Moana-Kakaako condo sales increased 11% to 679 units, while the median price declined 4% to $750,000. The median DOM rose 30% to 56 days, and the bid-up percentage fell 16% to 6.0%. MRI edged up 5% to 8.9 months, with active listings up 17% to 504 condos.
Makiki Condos
Makiki condo sales dipped 2% to 260 units, and the median price dropped 10% to $357,000. The median DOM increased 31% to 45 days, while the bid-up percentage declined 44% to 8.5%. MRI was unchanged at 5.9 months, and active listings eased 2% to 128 condos.
Waikiki Condos
Waikiki condo sales decreased 12% to 916 units, while the median price rose 2% to $450,000. The median DOM increased 30% to 42 days, and the bid-up percentage dropped 28% to 8.8%. MRI climbed 28% to 7.7 months, with active listings up 13% to 588 condos.
Kapiolani-University Condos
Kapiolani-University condo sales fell 3% to 222 units, with the median price down 1% to $400,000. The median DOM nearly doubled, up 88% to 40 days, while the bid-up percentage declined 36% to 11.3%. MRI rose 24% to 7.0 months, and active listings grew 21% to 129 condos.
Diamond Head-Kahala Condos
Diamond Head-Kahala condo sales rose 21% to 116 units, while the median price increased 2% to $658,000. The median DOM climbed 44% to 33 days, and the bid-up percentage declined 26% to 7.8%. MRI fell 23% to 6.0 months, while active listings dipped 6% to 58 condos.
Hawaii Kai Condos
Hawaii Kai condo sales increased 11% to 146 units, while the median price edged up 1% to $828,500. The median DOM more than doubled, up 106% to 34 days. The bid-up percentage dropped 38% to 15.1%. MRI rose 30% to 5.7 months, with active listings up 44% to 69 condos.
Kailua Condos
Kailua condo sales climbed 16% to 101 units, while the median price increased 4% to $819,000. The median DOM rose 11% to 21 days, and the bid-up percentage declined 18% to 17.8%. MRI decreased 20% to 3.0 months, while active listings fell 7% to 25 condos.
Kaneohe Condos
Kaneohe condo sales increased 7% to 161 units, though the median price fell 7% to $660,000. The median DOM rose 24% to 21 days, and the bid-up percentage dropped 27% to 20.5%. MRI surged 73% to 4.0 months, with active listings up 86% to 54 condos.
Leeward Condos
Leeward condo sales dipped 3% to 131 units, while the median price declined 6% to $230,000. The median DOM rose slightly, up 2% to 42 days, and the bid-up percentage increased 32% to 17.6%. MRI climbed 62% to 9.5 months, with active listings up 58% to 104 condos.
Ewa Condos
Ewa condo sales rose 12% to 366 units, while the median price fell 6% to $645,000. The median DOM jumped 77% to 39 days, and the bid-up percentage eased 2% to 30.3%. MRI increased 37% to 5.9 months, with active listings up 53% to 180 condos.
Makakilo Condos
Makakilo condo sales dipped 3% to 96 units, with the median price flat at $547,000. The median DOM increased 33% to 31 days, while the bid-up percentage declined 3% to 32.3%. MRI nearly tripled, rising 184% to 4.1 months, with active listings up 175% to 33 condos.
Waipahu Condos
Waipahu condo sales rose 9% to 158 units, while the median price decreased 4% to $495,500. The median DOM increased 56% to 27 days, and the bid-up percentage dropped 25% to 23.4%. MRI more than doubled, up 141% to 4.8 months, with active listings up 163% to 63 condos.
Mililani Condos
Mililani condo sales declined 8% to 258 units, while the median price was unchanged at $515,000. The median DOM rose 57% to 33 days, and the bid-up percentage dropped 14% to 31.4%. MRI climbed 46% to 4.0 months, with active listings up 34% to 86 condos.
Pearl City-Aiea Condos
Pearl City-Aiea condo sales fell 3% to 248 units, while the median price edged down 1% to $464,000. The median DOM rose 52% to 38 days, and the bid-up percentage decreased 33% to 21.0%. MRI increased 51% to 5.7 months, with active listings up 46% to 117 condos.
Summary
Because real estate market conditions can vary greatly among Oahu market areas, it's important for buyers and sellers to partner with a Realtor who has access to detailed, neighborhood-level data.
Glossary
- Active Listings: Count of MLS listings with "Active" status on the last day of the period.
- Bid-Up %: The percent of sales that were bid-up over asking price in competitive offers.
- Days on Market (DOM): Median number of days between listing date and escrow date, for all properties sold in the period.
- Months of Remaining Inventory (MRI): The number of months it would take to sell out the current active inventory at the recent rate of sales. A balance point between supply and demand is considered to be around 6 months, so MRI below 6 months indicates more of a sellers market and MRI above 6 months indicates more of a buyers market.