


What Happened in the Oahu Real Estate Market in December 2025?
The Oahu real estate market outperformed 2025 projections, closing the year with single-family home sales rising three percent and condo sales declining a modest two percent. Momentum strengthened in the second half of the year, with single-family home sales increasing 16 percent and condo sales up nine percent compared to the first half, signaling improved market activity despite a measured pullback in overall condo transactions.
Prices for the year rose by four percent for homes and dipped one percent for condos. However, the divergence between the two markets that characterized 2025 is reversing, as the condo market gradually strengthens. Remaining inventory decreased for both homes and condos in December 2025. The supply-demand balance is low for homes and balanced for condos.
“The Oahu real estate market is poised for moderate growth in 2026,” said Chief Sales Officer for Locations Chad Takesue. “Mortgage rates are trending lower and showing more stability, while strong sales and competitive market conditions point to renewed buyer demand.” He added that Locations expects moderate increases in sales activity and prices in 2026.
Limited for-sale inventory remains a challenge for buyers. In the condo market, half of all available re-sale units are in Waikiki and Ala Moana-Kakaako—an increase of 10 percent from last year. Inventory is mixed in other in-town condo markets, up in West Honolulu neighborhoods and down in East Honolulu neighborhoods. Outside of the urban core, inventory is low in most condo markets. However, two markets—Ewa and Pearl City—stand out with increased inventory and relatively lower prices.
In the single-family home market, available inventory is low in town, except for Nuuanu-Makiki, which has 24 percent more homes for sale than a year ago. Similarly, most West Oahu home markets are also low in inventory. However, with nearly 100 homes for sale each and the lowest median prices on Oahu, Ewa and Leeward offer buyers more options and greater affordability. With just 12 homes for sale at the end of 2025—a decrease of 57 percent—Mililani is the tightest home market..
Key Takeaways from the December 2025 Locations Oahu Real Estate Report
New to real estate market data terms? See our glossary.
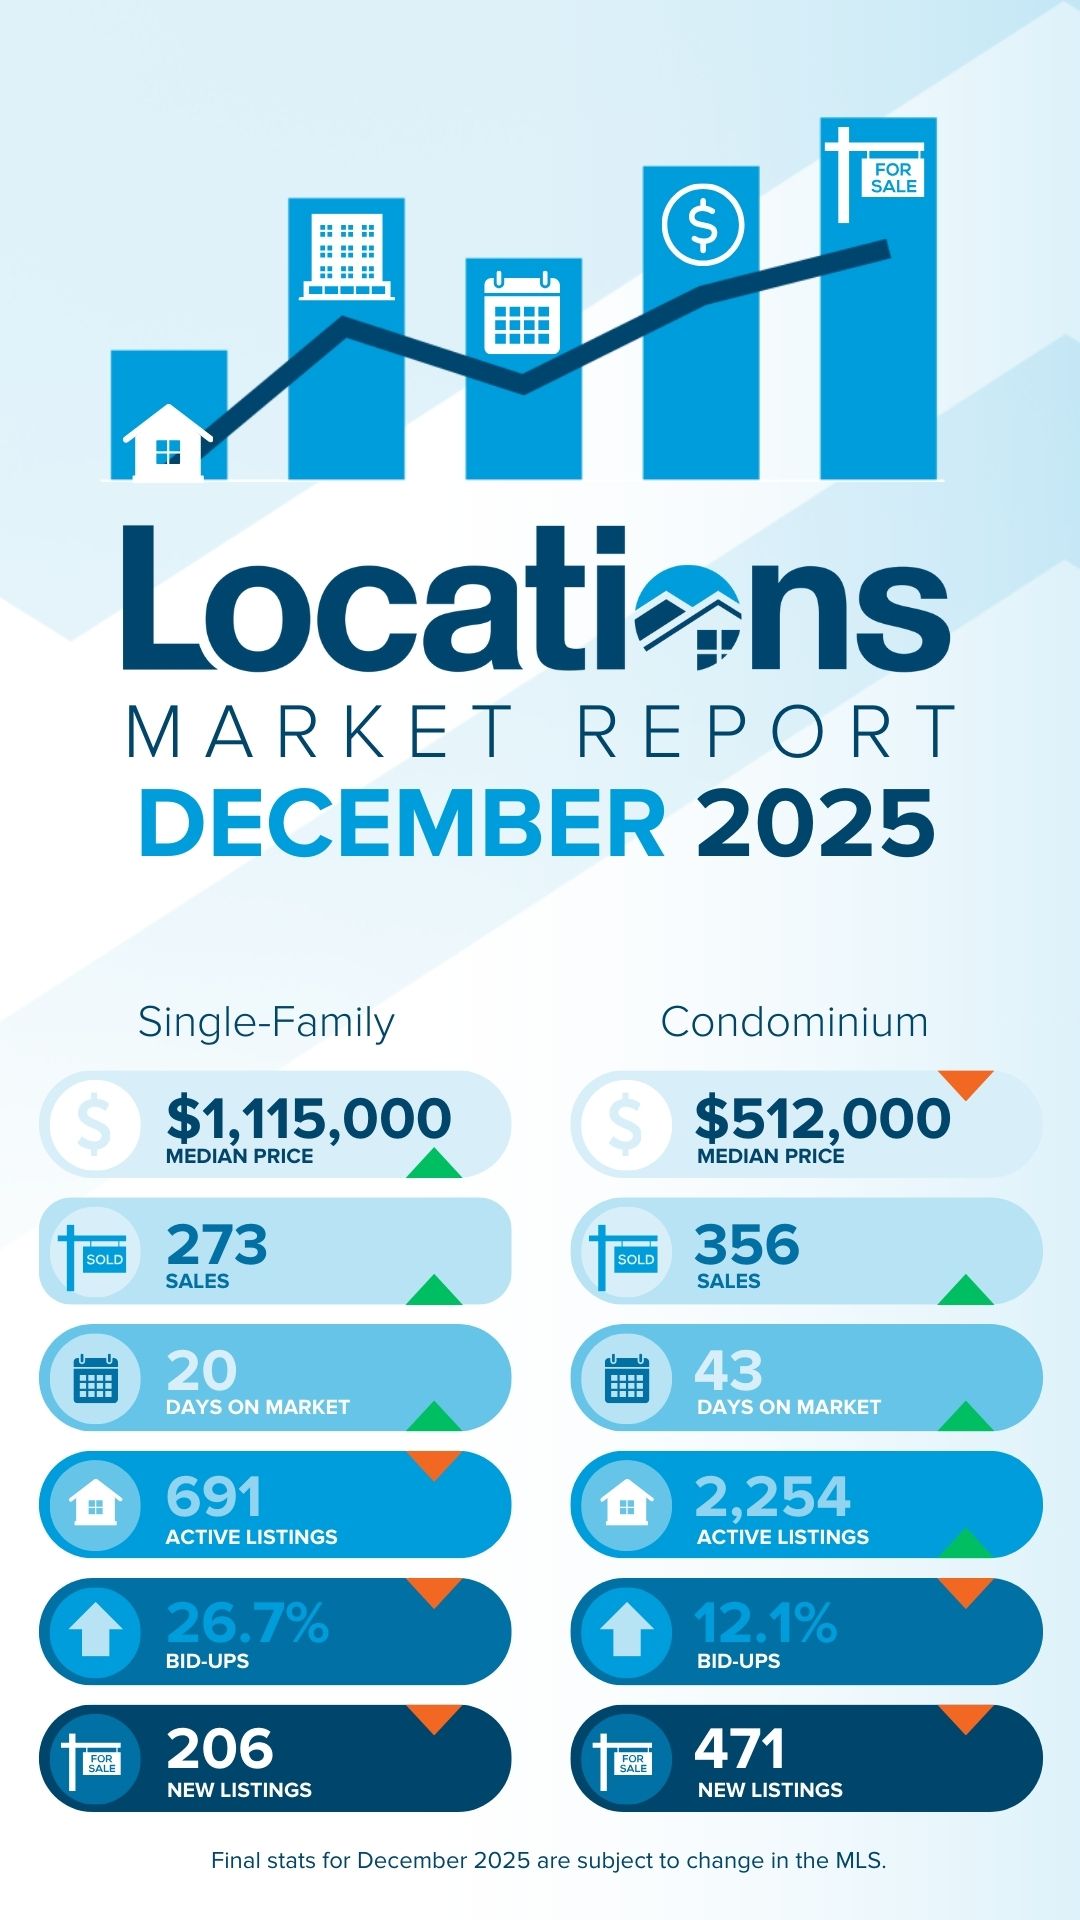
- In December 2025, the Oahu single-family home median price of $1,115,000 was up two percent from the previous month and five percent from a year ago. The condo median price of $512,000 was up seven percent from last month and down five percent from last year.
- Single-family home sales were up 19 percent from a year ago in December 2025, while condo sales were up eight percent. Sales are poised for further growth in 2026.
- There were 691 single-family homes and 2,254 condos listed for sale at the end of December 2025. Home inventory is now five percent lower than last year. Condo inventory is up 13 percent over last year and has been declining since mid-year.
- At the end of December 2025, Months of Remaining Inventory (MRI) was 2.9 months for homes, a decrease of eight percent from a year ago, and 6.1 months for condos, an increase of 14 percent. Homes are in greater demand now than a year ago.
- The median Days on Market (DOM) in December 2025 was 20 days for homes and 43 days for condos. Market times have generally been decreasing since mid-year.
- Competitive pressure continues. In December 2025, 26.7 percent of homes and 12.1 percent of condos sold were bid up over the asking price—one in every four homes and one in every eight condos—a decrease of 20 percent and 19 percent, respectively, from a year ago.
What Happened in Oahu Single-Family Home Markets in December 2025?
Market statistics can vary greatly by neighborhood, so it's important to consult a knowledgeable Realtor who has access to market-level data.
Here's a detailed breakdown of key Oahu single-family home market areas, looking at the past 12 months:
West Honolulu Homes
West Honolulu home sales rose 25% to 166 homes. The median price increased 5% to $1,077,500. The median DOM fell 11% to 17 days. The bid-up percentage climbed 7% to 38.0%. MRI declined 42% to 1.9 months, while active listings fell 28% to 26 homes.
Nuuanu-Makiki Homes
Nuuanu-Makiki home sales declined 2% to 114 homes. The median price increased 2% to $1,293,000. The median DOM jumped 100% to 34 days. The bid-up percentage fell 14% to 23.7%. MRI climbed 27% to 5.4 months, while active listings rose 24% to 51 homes.
Manoa Homes
Manoa home sales slipped 3% to 68 homes. The median price declined 5% to $1,600,000. The median DOM fell 23% to 16 days. The bid-up percentage climbed 29% to 29.4%. MRI declined 21% to 2.3 months, while active listings dropped 24% to 13 homes.
Kaimuki Homes
Kaimuki home sales surged 25% to 157 homes. The median price declined 4% to $1,250,000. The median DOM fell 18% to 14 days. The bid-up percentage edged up 2% to 29.9%. MRI declined 20% to 2.1 months, while active listings were unchanged at 27 homes.
Waialae-Kahala Homes
Waialae-Kahala home sales were flat at 87 homes. The median price jumped 17% to $2,700,000. The median DOM climbed 131% to 30 days. The bid-up percentage fell 39% to 25.3%. MRI declined 32% to 2.3 months, while active listings dropped 32% to 17 homes.
East Oahu Homes
East Oahu home sales rose 13% to 80 homes. The median price increased 4% to $1,925,000. The median DOM was unchanged at 20 days. The bid-up percentage surged 46% to 41.3%. MRI declined 24% to 2.7 months, while active listings fell 14% to 18 homes.
Hawaii Kai Homes
Hawaii Kai home sales rose 10% to 148 homes. The median price declined 3% to $1,622,500. The median DOM fell 6% to 16 days. The bid-up percentage slipped 15% to 25.7%. MRI increased 16% to 2.7 months, while active listings rose 27% to 33 homes.
Kailua Homes
Kailua home sales increased 7% to 253 homes. The median price rose 1% to $1,700,000. The median DOM climbed 29% to 18 days. The bid-up percentage fell 9% to 28.5%. MRI edged up 3% to 2.6 months, while active listings rose 10% to 55 homes.
Kaneohe Homes
Kaneohe home sales declined 7% to 195 homes. The median price increased 4% to $1,295,000. The median DOM fell 6% to 15 days. The bid-up percentage surged 49% to 40.5%. MRI increased 16% to 2.5 months, while active listings rose 8% to 41 homes.
North Shore Homes
North Shore home sales jumped 41% to 82 homes. The median price dipped 1% to $1,540,000. The median DOM climbed 25% to 38 days. The bid-up percentage fell 46% to 15.9%. MRI declined 42% to 6.0 months, while active listings dropped 18% to 41 homes.
Leeward Homes
Leeward home sales declined 14% to 214 homes. The median price slipped 1% to $670,000. The median DOM increased 36% to 48 days. The bid-up percentage climbed 12% to 25.7%. MRI rose 10% to 5.6 months, while active listings fell 5% to 100 homes.
Ewa Homes
Ewa home sales edged down 1% to 499 homes. The median price increased 4% to $930,000. The median DOM jumped 63% to 35 days. The bid-up percentage fell 11% to 27.7%. MRI declined 10% to 2.4 months, while active listings dropped 12% to 99 homes.
Makakilo Homes
Makakilo home sales rose 14% to 105 homes. The median price increased 6% to $1,084,000. The median DOM climbed 28% to 30 days. The bid-up percentage jumped 29% to 26.7%. MRI declined 15% to 3.4 months, while active listings slipped 3% to 30 homes.
Waipahu Homes
Waipahu home sales increased 7% to 185 homes. The median price dipped 1% to $950,000. The median DOM jumped 33% to 20 days. The bid-up percentage fell 19% to 34.1%. MRI declined 36% to 1.3 months, while active listings dropped 31% to 20 homes.
Mililani Homes
Mililani home sales declined 3% to 142 homes. The median price rose 1% to $1,085,000. The median DOM climbed 34% to 22 days. The bid-up percentage fell 13% to 30.3%. MRI declined 56% to 1.0 month, while active listings plunged 57% to 12 homes.
Pearl City-Aiea Homes
Pearl City-Aiea home sales declined 9% to 212 homes. The median price increased 2% to $1,081,500. The median DOM dipped 4% to 14 days. The bid-up percentage fell 13% to 32.1%. MRI was unchanged at 1.1 months, while active listings fell 9% to 20 homes.
What Happened in Oahu Condo Markets in December 2025?
Here's a detailed breakdown of key Oahu condo market areas, looking at the past 12 months:
Salt Lake Condos
Salt Lake condo sales rose 4% to 153 units, while the median price declined 6% to $399,900. The median Days on Market (DOM) climbed 71% to 48 days. The bid-up percentage dropped 49% to 11.8%. Months of Remaining Inventory (MRI) rose 27% to 5.8 months, and active listings increased 32% to 74 condos.
Downtown-Nuuanu Condos
Downtown-Nuuanu condo sales declined 11% to 228 units, while the median price fell 5% to $380,000. The median DOM increased 61% to 52 days. The bid-up percentage dropped 24% to 10.1%. MRI climbed 34% to 6.3 months, and active listings rose 20% to 119 condos.
Ala Moana-Kakaako Condos
Ala Moana-Kakaako condo sales rose 13% to 686 units, while the median price declined 4% to $750,000. The median DOM increased 14% to 56 days. The bid-up percentage edged up 10% to 6.6%. MRI dipped 4% to 8.9 months, and active listings increased 9% to 511 condos.
Makiki Condos
Makiki condo sales declined 6% to 263 units, while the median price fell 13% to $345,000. The median DOM climbed 19% to 46 days. The bid-up percentage dropped 48% to 7.2%. MRI declined 8% to 4.9 months, and active listings fell 14% to 108 condos.
Waikiki Condos
Waikiki condo sales declined 8% to 924 units, while the median price dipped 2% to $440,000. The median DOM increased 42% to 47 days. The bid-up percentage fell 33% to 8.3%. MRI rose 22% to 7.4 months, and active listings increased 12% to 567 condos.
Kapiolani-University Condos
Kapiolani-University condo sales declined 3% to 225 units, while the median price slipped 2% to $395,000. The median DOM climbed 51% to 37 days. The bid-up percentage dropped 56% to 7.6%. MRI increased 9% to 6.0 months, and active listings rose 6% to 112 condos.
Diamond Head-Kahala Condos
Diamond Head-Kahala condo sales declined 5% to 109 units, while the median price fell 5% to $630,000. The median DOM surged 263% to 58 days. The bid-up percentage dropped 32% to 8.3%. MRI was unchanged at 5.7 months, and active listings dipped 5% to 52 condos.
Hawaii Kai Condos
Hawaii Kai condo sales rose 9% to 151 units, while the median price increased 3% to $845,000. The median DOM jumped 118% to 37 days. The bid-up percentage fell 53% to 11.9%. MRI increased 16% to 5.0 months, and active listings climbed 26% to 63 condos.
Kailua Condos
Kailua condo sales increased 11% to 107 units, while the median price dipped 2% to $800,000. The median DOM rose 11% to 21 days. The bid-up percentage edged down 5% to 15.9%. MRI increased 15% to 2.6 months, and active listings rose 28% to 23 condos.
Kaneohe Condos
Kaneohe condo sales rose 1% to 165 units, while the median price declined 4% to $660,000. The median DOM climbed 67% to 25 days. The bid-up percentage dropped 40% to 15.8%. MRI was essentially flat at 3.0 months, and active listings were unchanged at 41 condos
Leeward Condos
Leeward condo sales declined 9% to 125 units, while the median price fell 5% to $230,000. The median DOM slipped 9% to 42 days. The bid-up percentage jumped 46% to 16.0%. MRI rose 23% to 9.0 months, and active listings increased 12% to 94 condos.
Ewa Condos
Ewa condo sales rose 12% to 378 units, while the median price declined 5% to $645,500. The median DOM climbed 52% to 41 days. The bid-up percentage fell 25% to 25.1%. MRI increased 14% to 5.2 months, and active listings jumped 28% to 164 condos.
Makakilo Condos
Makakilo condo sales declined 6% to 94 units, while the median price dipped 2% to $547,500. The median DOM increased 11% to 32 days. The bid-up percentage edged down 6% to 31.9%. MRI surged 87% to 4.7 months, and active listings soared 76% to 37 condos.
Waipahu Condos
Waipahu condo sales rose 8% to 162 units, while the median price declined 4% to $485,000. The median DOM jumped 123% to 34 days. The bid-up percentage fell 20% to 24.1%. MRI slipped 7% to 3.3 months, and active listings were unchanged at 45 condos.
Mililani Condos
Mililani condo sales declined 14% to 256 units, while the median price was unchanged at $515,000. The median DOM climbed 79% to 39 days. The bid-up percentage fell 17% to 28.5%. MRI surged 53% to 3.3 months, and active listings rose 31% to 71 condos.
Pearl City-Aiea Condos
Pearl City-Aiea condo sales declined 7% to 253 units, while the median price fell 5% to $444,000. The median DOM increased 68% to 42 days. The bid-up percentage dropped 30% to 19.8%. MRI climbed 31% to 5.5 months, and active listings rose 21% to 115 condos.
Summary
Because real estate market conditions can vary greatly among Oahu market areas, it's important for buyers and sellers to partner with a Realtor who has access to detailed, neighborhood-level data.
Glossary
- Active Listings: Count of MLS listings with "Active" status on the last day of the period.
- Bid-Up %: The percent of sales that were bid-up over asking price in competitive offers.
- Days on Market (DOM): Median number of days between listing date and escrow date, for all properties sold in the period.
- Months of Remaining Inventory (MRI): The number of months it would take to sell out the current active inventory at the recent rate of sales. A balance point between supply and demand is considered to be around 6 months, so MRI below 6 months indicates more of a sellers market and MRI above 6 months indicates more of a buyers market.