


What Happened in the Oahu Real Estate Market in November 2025?
The Oahu real estate market has maintained a steady pace in 2025. The single-family home market is particularly strong—twice as strong as the condo market, by many indicators. Homes have been entering into escrow in about three weeks—half the time of condos. In the home market, there are 3.2 months of remaining inventory, while condo inventory is 6.6 months. Year to date, one in three home sales were bid up over the asking price, compared to one in seven condos. The year is projected to end with home sales and prices up by about three percent and condo sales and prices even with the previous year. However, the gap between the home and condo markets that characterized 2025 is beginning to shrink, as the condo market gradually strengthens.
“We expect to see moderate growth in the Oahu real estate market next year, if trends continue,” said Chief Sales Officer for Locations Chad Takesue. “While the familiar challenges of affordability and economic uncertainty remain, demand continues to outpace the limited supply of available housing.”
Year-to-date, the islandwide single-family home price has increased by three percent. At the local-market level, home prices are highest in Waialae-Kahala, with a median price of $2,575,000—up 11 percent from a year ago and a reflection of stronger demand for luxury homes, as well as the diverse mix of home sales in the area. In the high-priced home markets of East Oahu (median price of $1,815,000) and Hawaii Kai (median price of $1,625,000), prices slipped three percent from last year. In Oahu’s second-highest priced single-family home market, Kailua, the median price ticked up one percent from 2024 to $1,685,000.
In West Oahu markets, where the median price for single-family homes is closer to $1 million, Makakilo has had the greatest increase this year, up nine percent to $1,099,500. The median price in Ewa increased by four percent to $930,000. Leeward Oahu has the lowest home prices on the island, with a median price of $675,000—unchanged from 2024.
The islandwide condo median price has remained flat in 2025, even as median prices have decreased in most local markets. In urban markets, resale condo median prices have declined by an average of six percent compared to 2024—a reflection of infrastructure and insurance issues affecting aging housing stock. The Makiki market experienced the steepest drop in median price, a 13-percent decline to $345,000. In the largest condo market, Waikiki, the median price has remained flat at $435,000.
Outside of the urban core, where larger 2- or 3- bedroom townhomes are typical, median prices increased slightly—up half-a-percent to $845,000 in Hawaii Kai, up two percent to $809,500 in Kailua, and up one percent to $515,000 in Mililani.
Key Takeaways from the November 2025 Locations Oahu Real Estate Report
New to real estate market data terms? See our glossary.
-
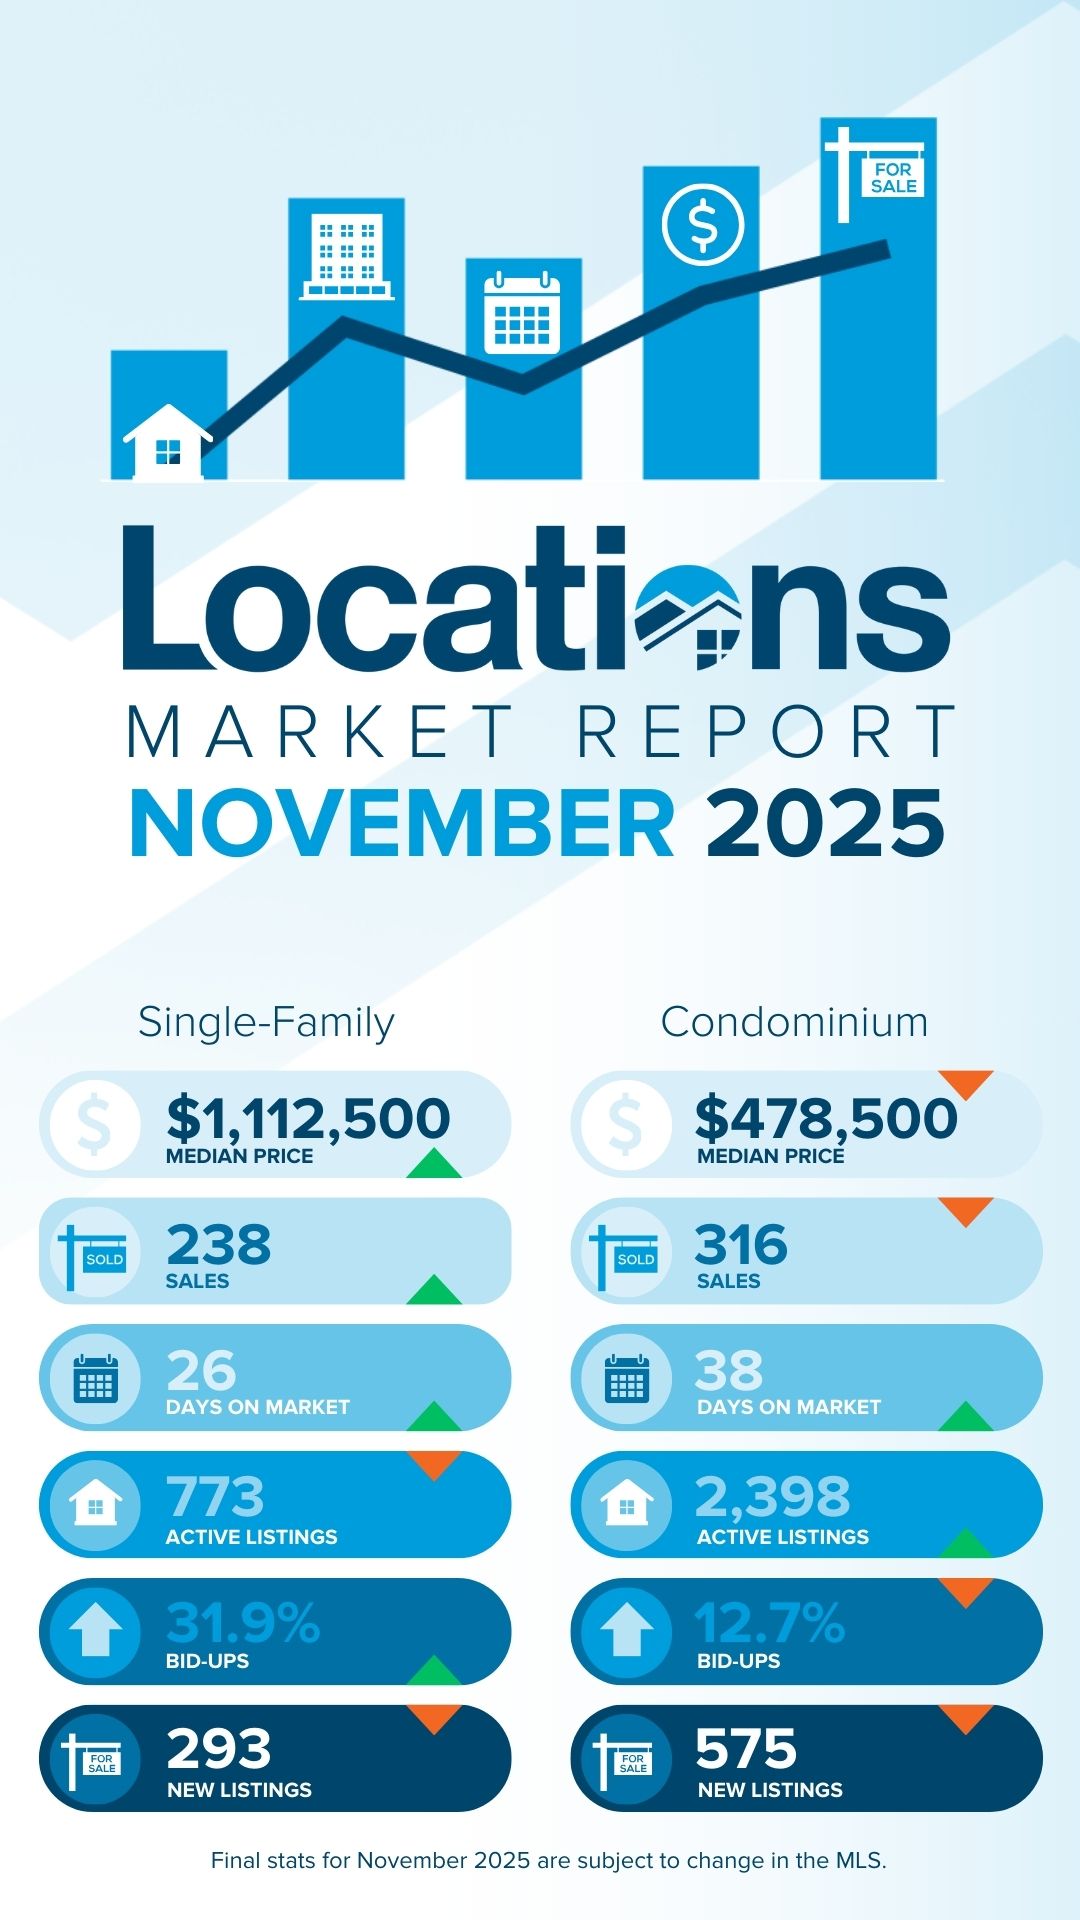
In November 2025, the Oahu single-family home median price of $1,112,500 was five percent lower than the previous month and one percent higher than a year ago. The condo median price of $478,500 was 11 percent lower than last month and nine percent lower than last year.
-
Single-family home sales were up 16 percent from a year ago—unusually strong for November. Condo sales were down eight percent compared to last year, in line with the typical seasonal trend.
-
There were 773 single-family homes and 2,398 condos listed for sale at the end of November 2025. Home inventory is now two percent lower than last year. Condo inventory is up 14 percent over last year and holding level this year, after steadily declining for the past several months.
-
At the end of November 2025, Months of Remaining Inventory (MRI) was 3.2 months for homes, a decrease of five percent from a year ago, and 6.6 months for condos, an increase of 15 percent. Single-family homes are in greater demand than a year ago, affecting the supply-demand balance.
-
The median Days on Market (DOM) in November 2025 was 26 days for homes and 38 days for condos. Condos have been selling more quickly since mid-year.
-
Competitive pressure continues. In November 2025, 31.9 percent of homes and 12.7 percent of condos sold were bid up over the asking price—about one in every three homes and one in every eight condos.
What Happened in Oahu Single-Family Home Markets in November 2025?
Market statistics can vary greatly by neighborhood, so it's important to consult a knowledgeable Realtor who has access to market-level data.
Here's a detailed breakdown of key Oahu single-family home market areas, looking at the past 12 months:
West Honolulu Homes
West Honolulu home sales rose 25% to 162 homes. The median price increased 1% to $1,040,000. The median DOM rose 3% to 19 days. The bid-up percentage climbed 18% to 38.9%. MRI declined 28% to 2.5 months, while active listings fell 11% to 34 homes.
Nuuanu-Makiki Homes
Nuuanu-Makiki home sales declined 10% to 107 homes. The median price increased 5% to $1,300,000. The median DOM jumped 127% to 34 days. The bid-up percentage fell 10% to 23.4%. MRI climbed 41% to 7.0 months, while active listings rose 27% to 62 homes.
Manoa Homes
Manoa home sales inched up 1% to 68 homes. The median price dipped 3% to $1,637,500. The median DOM fell 30% to 14 days. The bid-up percentage climbed 35% to 32.4%. MRI declined 51% to 1.8 months, while active listings dropped 50% to 10 homes.
Kaimuki Homes
Kaimuki home sales rose 21% to 152 homes. The median price declined 4% to $1,246,500. The median DOM fell 15% to 15 days. The bid-up percentage was nearly flat, up 1% to 29.6%. MRI declined 22% to 2.4 months, while active listings slipped 6% to 31 homes.
Waialae-Kahala Homes
Waialae-Kahala home sales increased 19% to 93 homes. The median price rose 11% to $2,575,000. The median DOM climbed 61% to 25 days. The bid-up percentage fell 27% to 28.0%. MRI declined 41% to 2.2 months, while active listings dropped 29% to 17 homes.
East Oahu Homes
East Oahu home sales rose 6% to 76 homes. The median price slipped 3% to $1,815,000. The median DOM increased 14% to 21 days. The bid-up percentage climbed 35% to 39.5%. MRI increased 8% to 3.9 months, while active listings rose 14% to 25 homes.
Hawaii Kai Homes
Hawaii Kai home sales rose 4% to 147 homes. The median price declined 3% to $1,625,000. The median DOM fell 11% to 16 days. The bid-up percentage edged up 2% to 27.2%. MRI climbed 45% to 2.9 months, while active listings jumped 50% to 36 homes.
Kailua Homes
Kailua home sales increased 15% to 259 homes. The median price rose 1% to $1,685,000. The median DOM climbed 29% to 18 days. The bid-up percentage slipped 9% to 28.6%. MRI dipped 5% to 2.8 months, while active listings rose 9% to 60 homes.
Kaneohe Homes
Kaneohe home sales declined 6% to 196 homes. The median price rose 3% to $1,261,500. The median DOM fell 13% to 14 days. The bid-up percentage surged 53% to 41.3%. MRI increased 4% to 2.8 months, while active listings slipped 2% to 46 homes.
North Shore Homes
North Shore home sales jumped 34% to 78 homes. The median price dipped 2% to $1,500,000. The median DOM climbed 61% to 40 days. The bid-up percentage slid 43% to 16.7%. MRI declined 26% to 7.4 months, while active listings were unchanged at 48 homes.
Leeward Homes
Leeward home sales declined 12% to 212 homes. The median price was unchanged at $674,989. The median DOM increased 13% to 41 days. The bid-up percentage climbed 24% to 27.4%. MRI rose 13% to 5.7 months, while active listings edged down 1% to 100 homes.
Ewa Homes
Ewa home sales slipped 2% to 481 homes. The median price increased 4% to $930,000. The median DOM jumped 71% to 36 days. The bid-up percentage fell 11% to 28.3%. MRI declined 3% to 2.9 months, while active listings dipped 6% to 115 homes.
Makakilo Homes
Makakilo home sales surged 33% to 112 homes. The median price rose 9% to $1,099,500. The median DOM climbed 16% to 29 days. The bid-up percentage jumped 50% to 26.8%. MRI declined 10% to 4.0 months, while active listings rose 19% to 37 homes.
Waipahu Homes
Waipahu home sales increased 10% to 184 homes. The median price dipped 1% to $950,000. The median DOM climbed 19% to 19 days. The bid-up percentage fell 18% to 34.2%. MRI declined 47% to 1.2 months, while active listings dropped 42% to 19 homes.
Mililani Homes
Mililani home sales eased 1% to 142 homes. The median price rose 3% to $1,100,000. The median DOM jumped 63% to 26 days. The bid-up percentage slipped 13% to 28.9%. MRI declined 11% to 1.8 months, while active listings fell 13% to 21 homes.
Pearl City-Aiea Homes
Pearl City-Aiea home sales declined 16% to 200 homes. The median price was unchanged at $1,062,500. The median DOM remained steady at 14 days. The bid-up percentage fell 10% to 33.5%. MRI declined 11% to 1.6 months, while active listings dropped 25% to 27 homes.
What Happened in Oahu Condo Markets in November 2025?
Here's a detailed breakdown of key Oahu condo market areas, looking at the past 12 months:
Salt Lake Condos
Salt Lake condo sales declined 2% to 147 units, while the median price fell 6% to $400,000. The median Days on Market (DOM) climbed 78% to 48 days. The bid-up percentage dropped 55% to 10.9%. Months of Remaining Inventory (MRI) rose 23% to 6.3 months, and active listings increased 20% to 77 condos.
Downtown-Nuuanu Condos
Downtown-Nuuanu condo sales declined 11% to 227 units, with the median price down 5% to $380,000. The median DOM increased 59% to 51 days, while the bid-up percentage fell 29% to 9.7%. MRI climbed 24% to 6.8 months, and active listings rose 10% to 128 condos.
Ala Moana-Kakaako Condos
Ala Moana-Kakaako condo sales rose 14% to 687 units, while the median price declined 4% to $750,000. The median DOM increased 15% to 54 days, and the bid-up percentage dipped 14% to 6.0%. MRI edged down 2% to 9.3 months, with active listings up 12% to 534 condos.
Makiki Condos
Makiki condo sales declined 3% to 263 units, and the median price decreased 13% to $345,000. The median DOM climbed 23% to 46 days, while the bid-up percentage dropped 37% to 8.4%. MRI slipped 4% to 5.3 months, and active listings fell 7% to 116 condos.
Waikiki Condos
Waikiki condo sales declined 8% to 920 units, while the median price dipped 1% to $435,000. The median DOM climbed 42% to 47 days, and the bid-up percentage dropped 33% to 8.3%. MRI increased 24% to 7.9 months, with active listings up 14% to 608 condos.
Kapiolani-University Condos
Kapiolani-University condo sales declined 5% to 105 units, while the median price fell 3% to $630,000. The median DOM jumped 176% to 47 days, and the bid-up percentage dropped 55% to 5.7%. MRI declined 12% to 5.9 months, while active listings fell 16% to 52 condos.
Diamond Head-Kahala Condos
Diamond Head-Kahala condo sales declined 5% to 105 units, while the median price fell 3% to $630,000. The median DOM jumped 176% to 47 days, and the bid-up percentage dropped 55% to 5.7%. MRI declined 12% to 5.9 months, while active listings fell 16% to 52 condos.
Hawaii Kai Condos
Hawaii Kai condo sales rose 14% to 151 units, while the median price was unchanged at $845,000. The median DOM jumped 131% to 37 days. The bid-up percentage dropped 48% to 13.2%. MRI increased 17% to 5.7 months, with active listings up 33% to 72 condos.
Kailua Condos
Kailua condo sales rose 14% to 104 units, while the median price increased 2% to $809,500. The median DOM climbed 42% to 26 days, and the bid-up percentage declined 17% to 16.3%. MRI slipped 20% to 2.4 months, while active listings fell 9% to 21 condos.
Kaneohe Condos
Kaneohe condo sales rose 6% to 165 units, though the median price fell 5% to $660,000. The median DOM increased 47% to 22 days, and the bid-up percentage dropped 43% to 15.8%. MRI edged up 6% to 3.3 months, with active listings rising 13% to 45 condos.
Leeward Condos
Leeward condo sales declined 7% to 127 units, while the median price fell 8% to $225,000. The median DOM fell 7% to 42 days, and the bid-up percentage climbed 54% to 18.1%. MRI rose 32% to 9.6 months, with active listings up 23% to 102 condos.
Ewa Condos
Ewa condo sales increased 14% to 377 units, while the median price declined 5% to $645,000. The median DOM climbed 50% to 39 days, and the bid-up percentage fell 18% to 26.5%. MRI rose 8% to 5.5 months, with active listings up 23% to 173 condos.
Makakilo Condos
Makakilo condo sales declined 9% to 92 units, with the median price down 2% to $547,500. The median DOM climbed 10% to 29 days, while the bid-up percentage dipped 6% to 31.5%. MRI surged 154% to 5.7 months, with active listings soaring 132% to 44 condos.
Waipahu Condos
Waipahu condo sales increased 5% to 156 units, while the median price dipped 2% to $490,000. The median DOM jumped 120% to 33 days, and the bid-up percentage fell 18% to 23.7%. MRI rose 40% to 4.4 months, with active listings up 46% to 57 condos.
Mililani Condos
Mililani condo sales declined 14% to 252 units, while the median price edged up 1% to $515,000. The median DOM climbed 86% to 39 days, and the bid-up percentage fell 17% to 29.8%. MRI rose 44% to 3.8 months, with active listings up 23% to 79 condos.
Pearl City-Aiea Condos
Pearl City-Aiea condo sales declined 8% to 249 units, while the median price dipped 4% to $450,000. The median DOM rose 71% to 41 days, and the bid-up percentage declined 28% to 20.9%. MRI increased 35% to 5.6 months, with active listings up 24% to 117 condos.
Summary
Because real estate market conditions can vary greatly among Oahu market areas, it's important for buyers and sellers to partner with a Realtor who has access to detailed, neighborhood-level data.
Glossary
- Active Listings: Count of MLS listings with "Active" status on the last day of the period.
- Bid-Up %: The percent of sales that were bid-up over asking price in competitive offers.
- Days on Market (DOM): Median number of days between listing date and escrow date, for all properties sold in the period.
- Months of Remaining Inventory (MRI): The number of months it would take to sell out the current active inventory at the recent rate of sales. A balance point between supply and demand is considered to be around 6 months, so MRI below 6 months indicates more of a sellers market and MRI above 6 months indicates more of a buyers market.